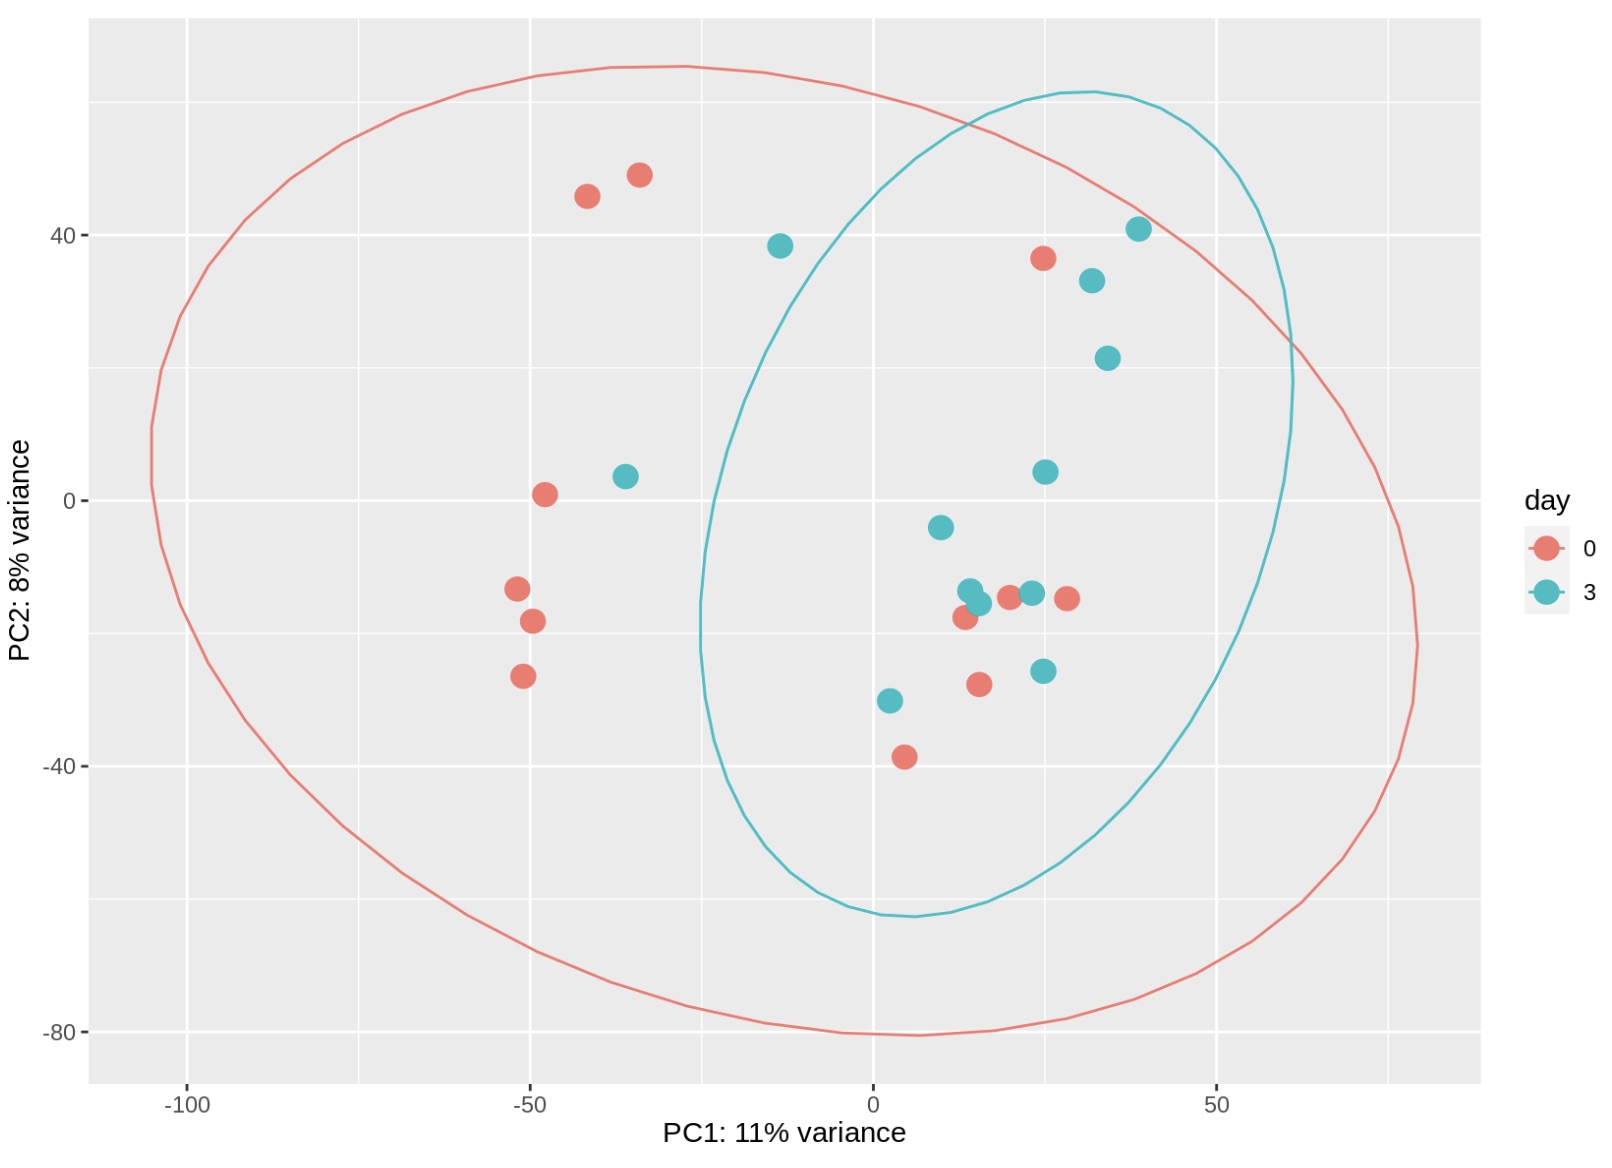
I ran PCA’s and got significant DEG lists for every pairwise comparison between the true control (control, day 0) and day 3 of every treatment (ocean acidification (OA), ocean warming (OW), hypoxia (DO), and control). PCA’s are below. Ellipses are 95% confidence areas (?). DEG’s are in my environment on Raven, not sure what to do with them as of yet.
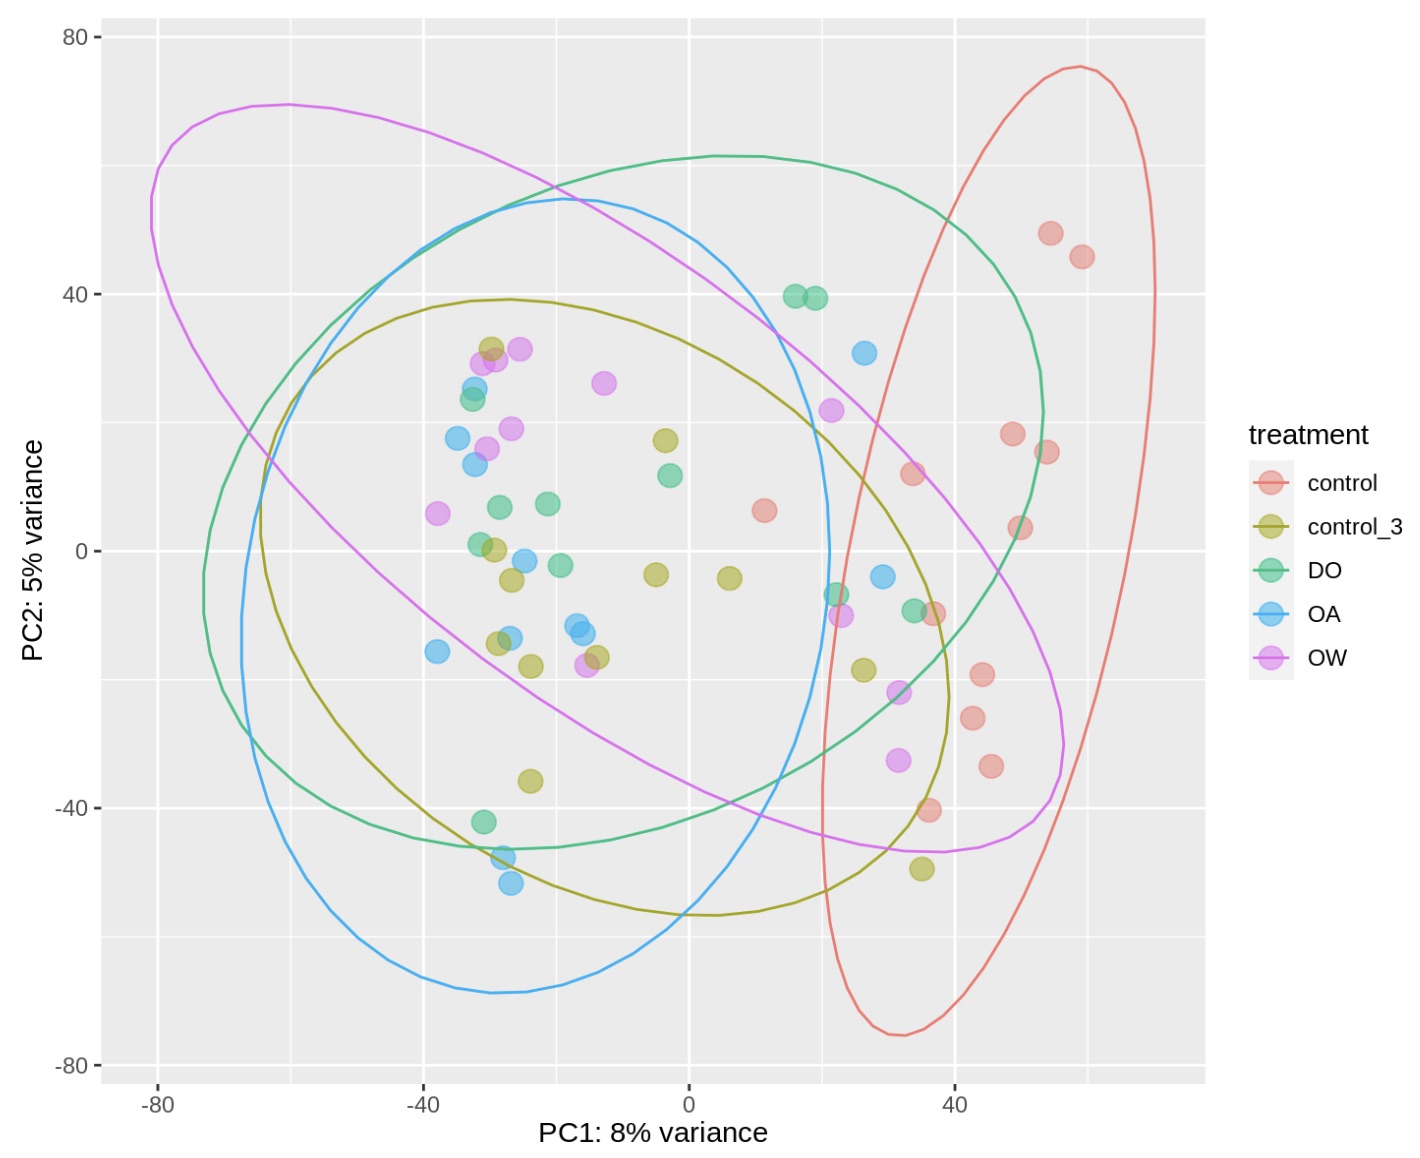
Foot PCA Plots
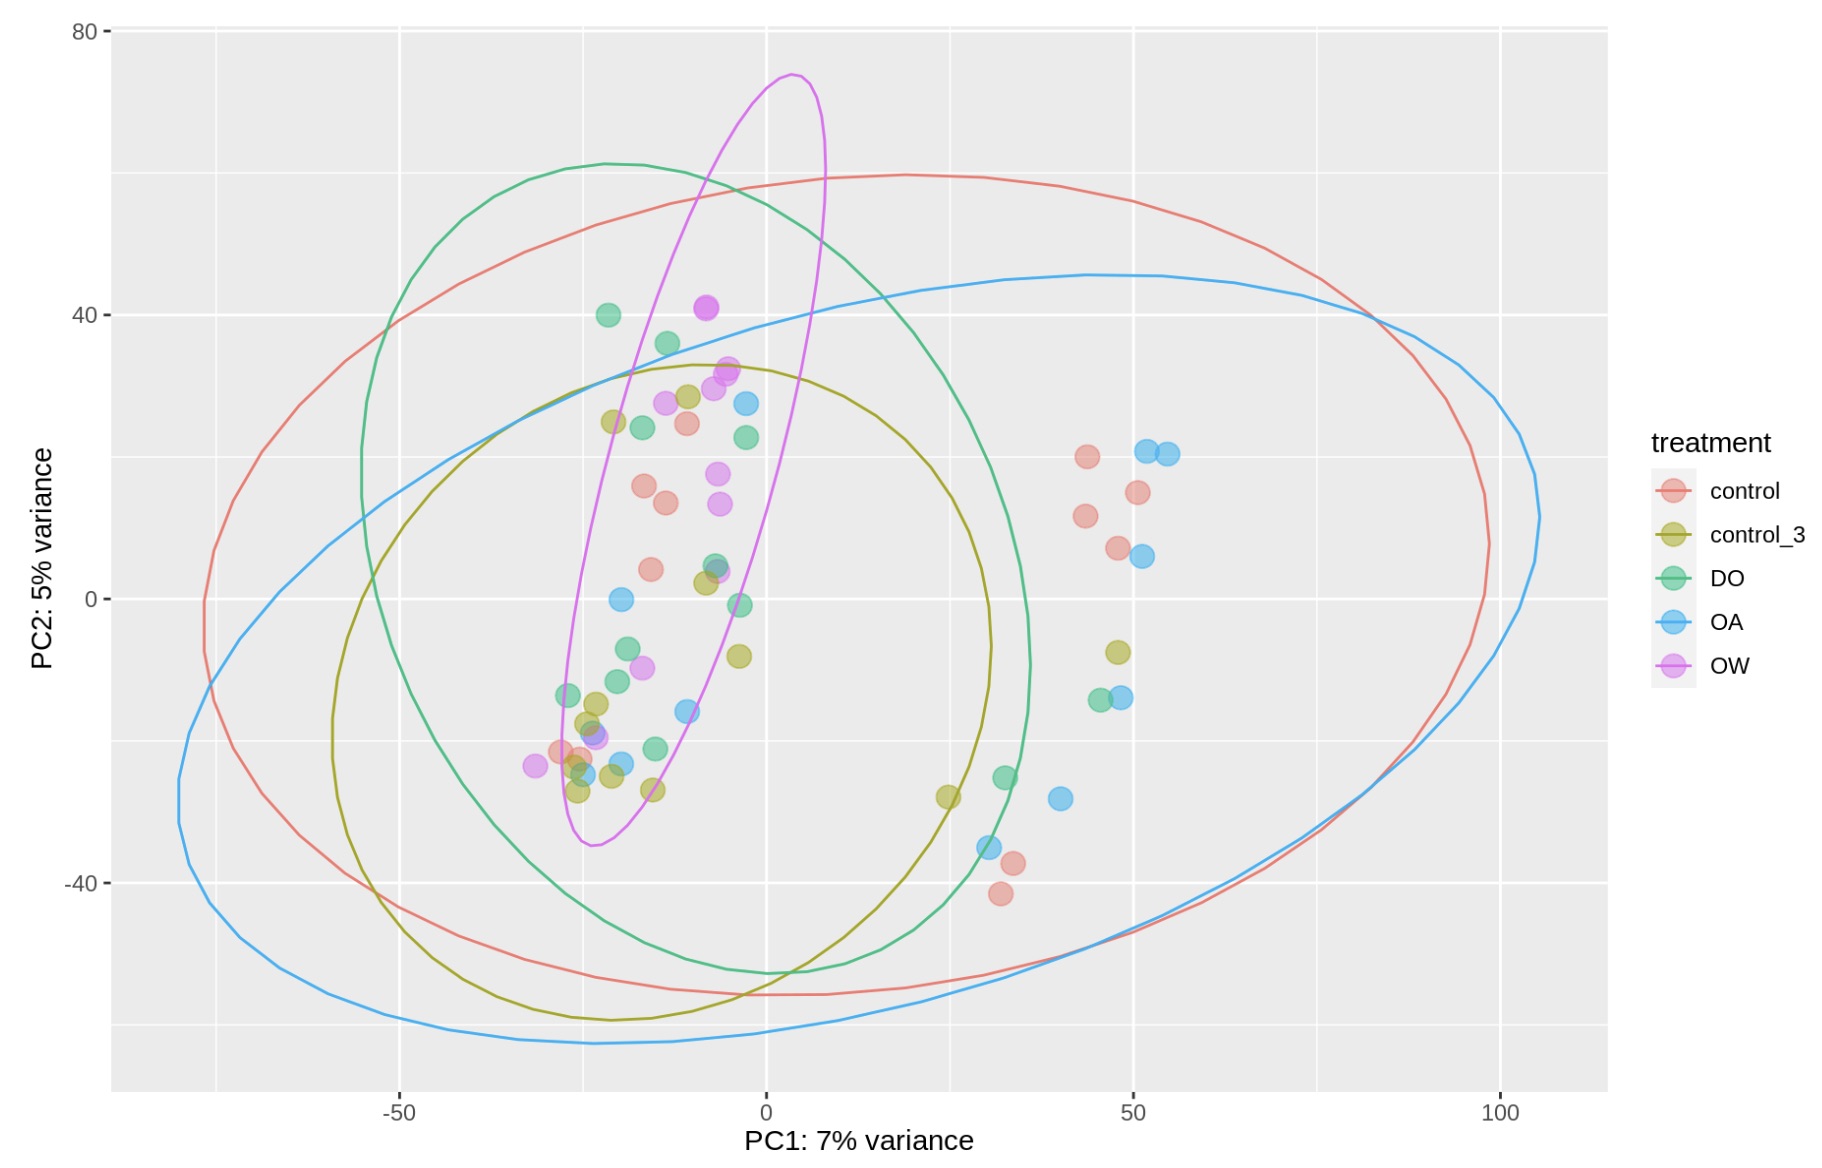
Overall
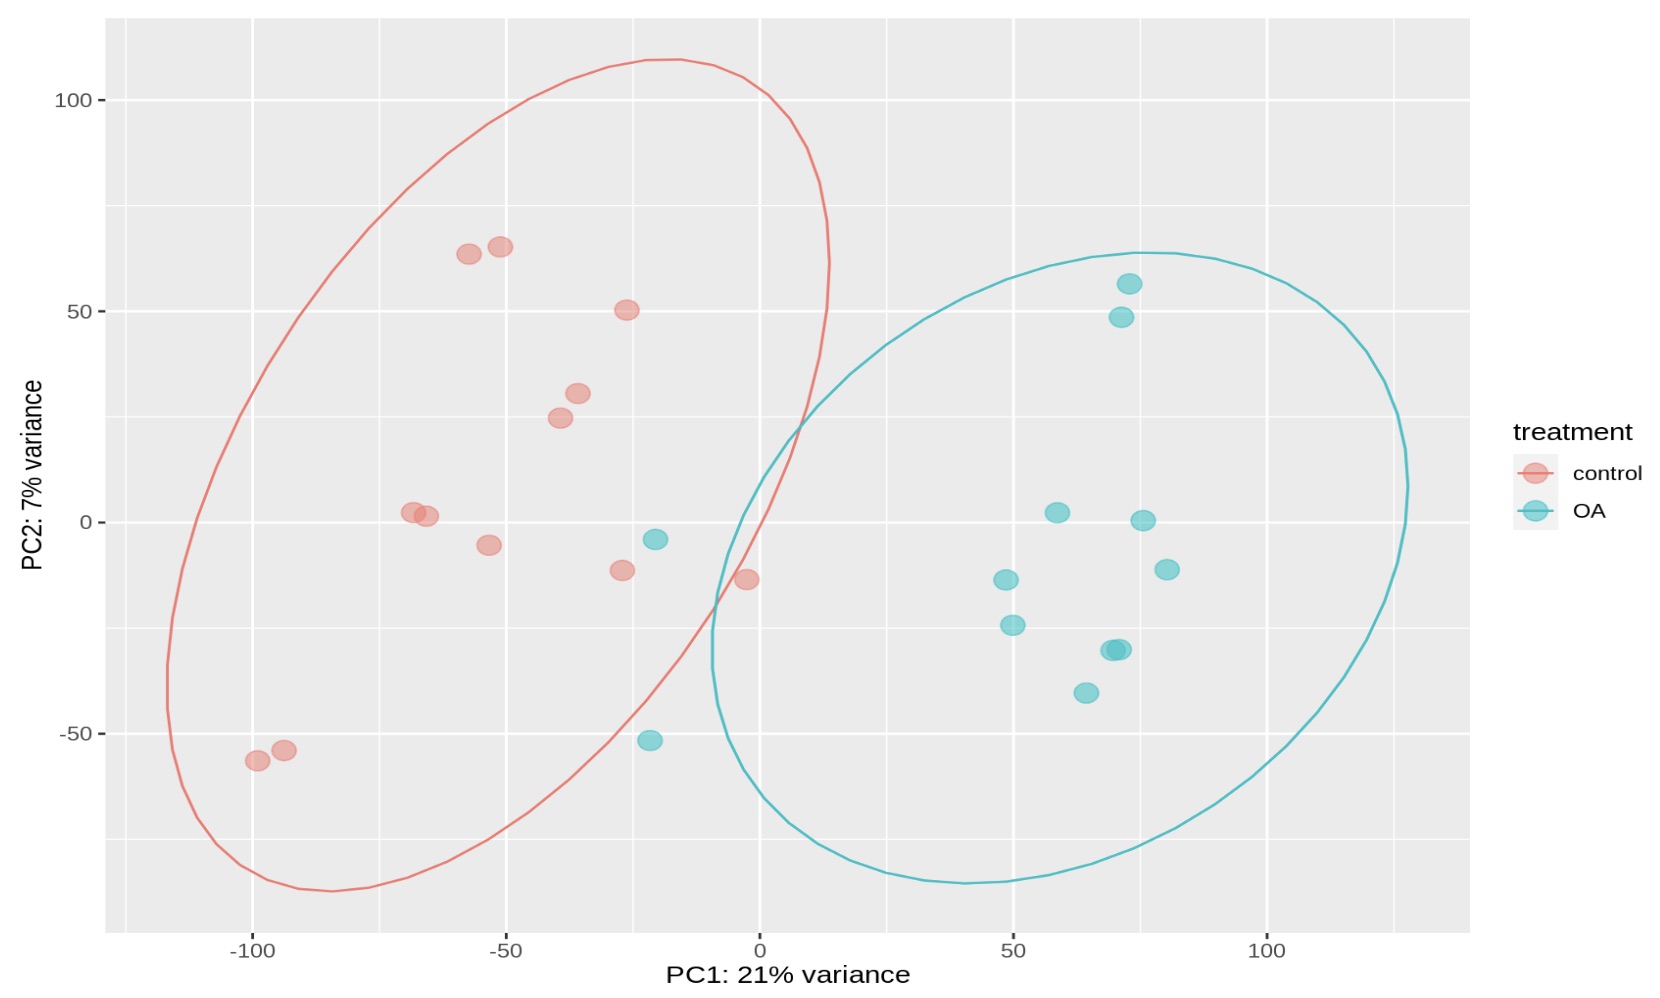
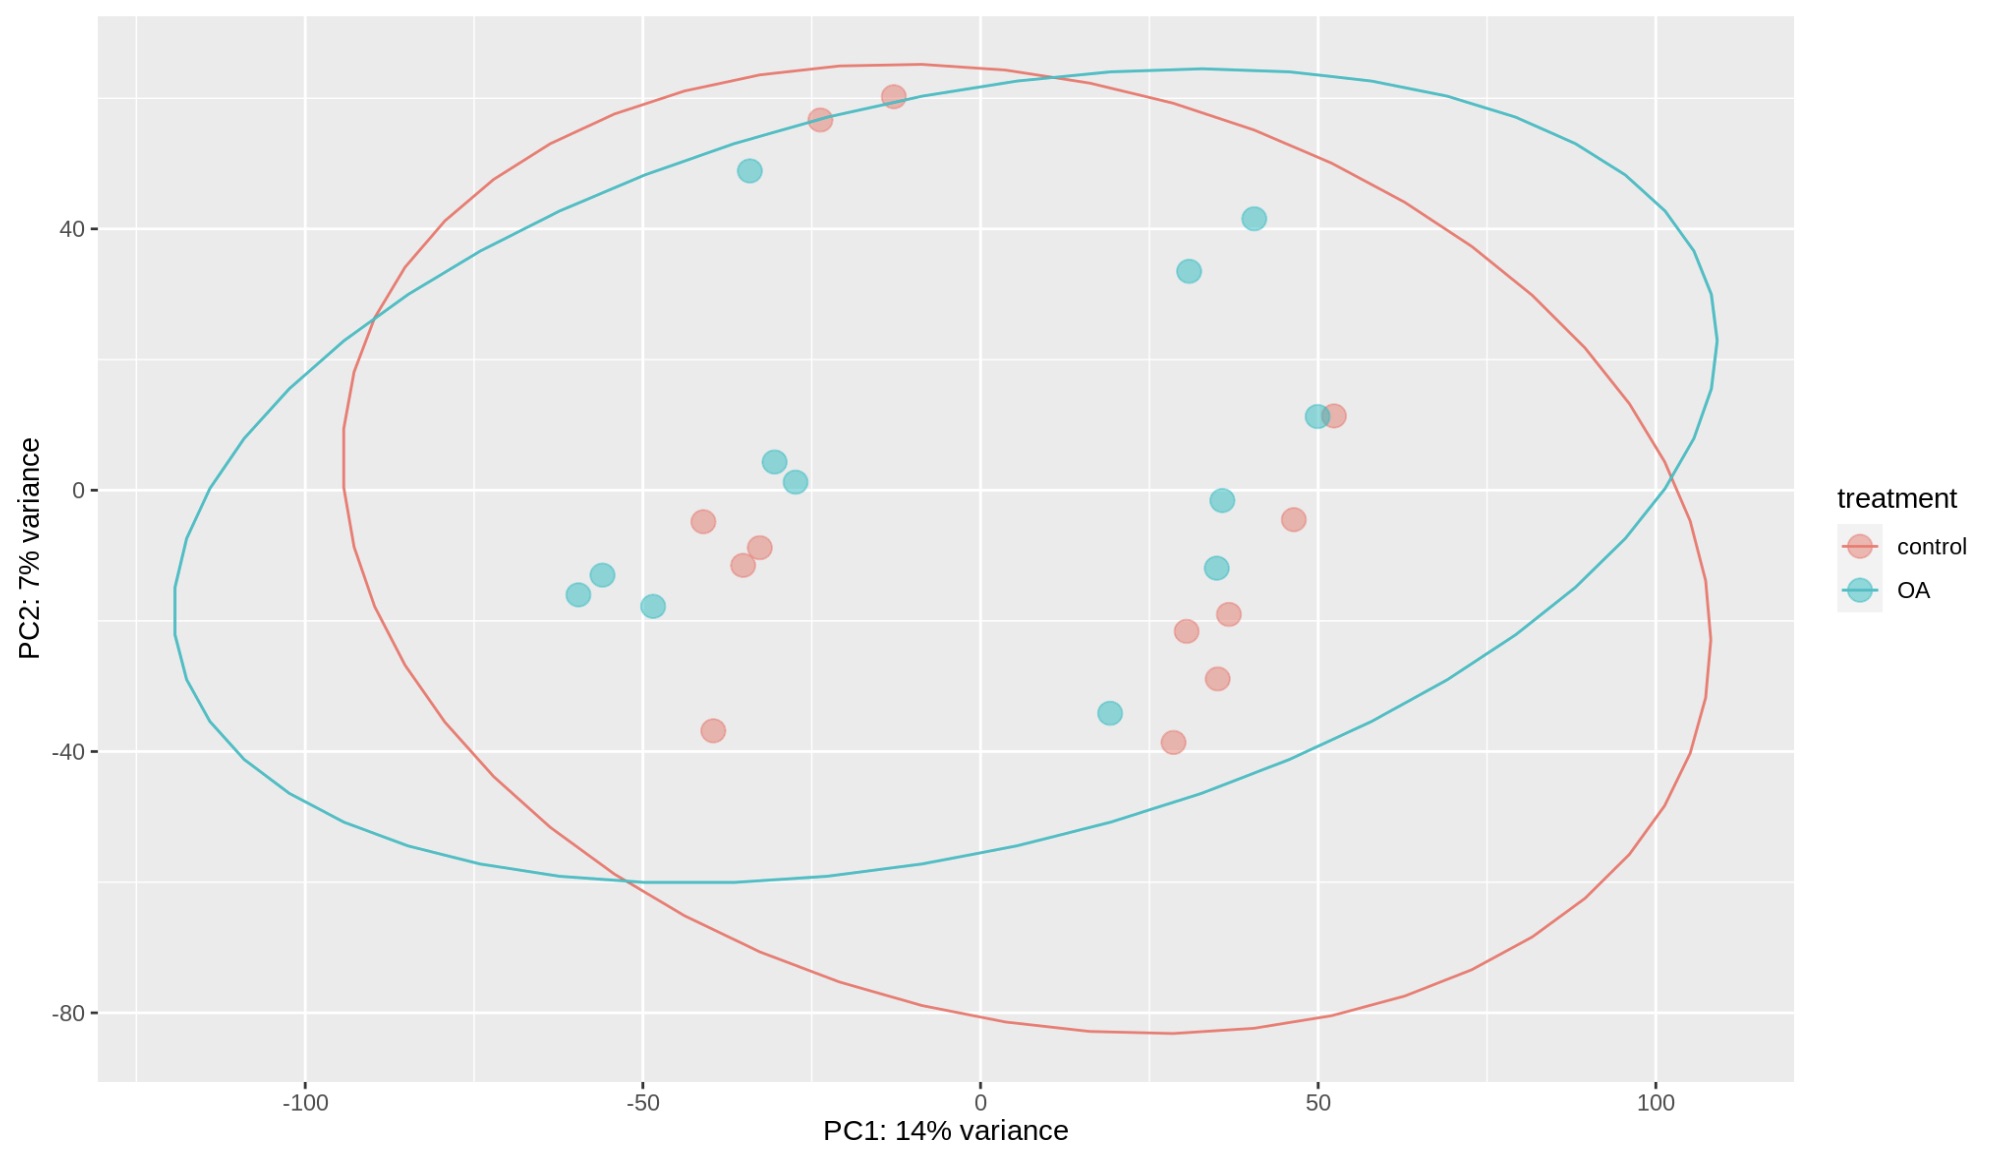
Ocean acidification
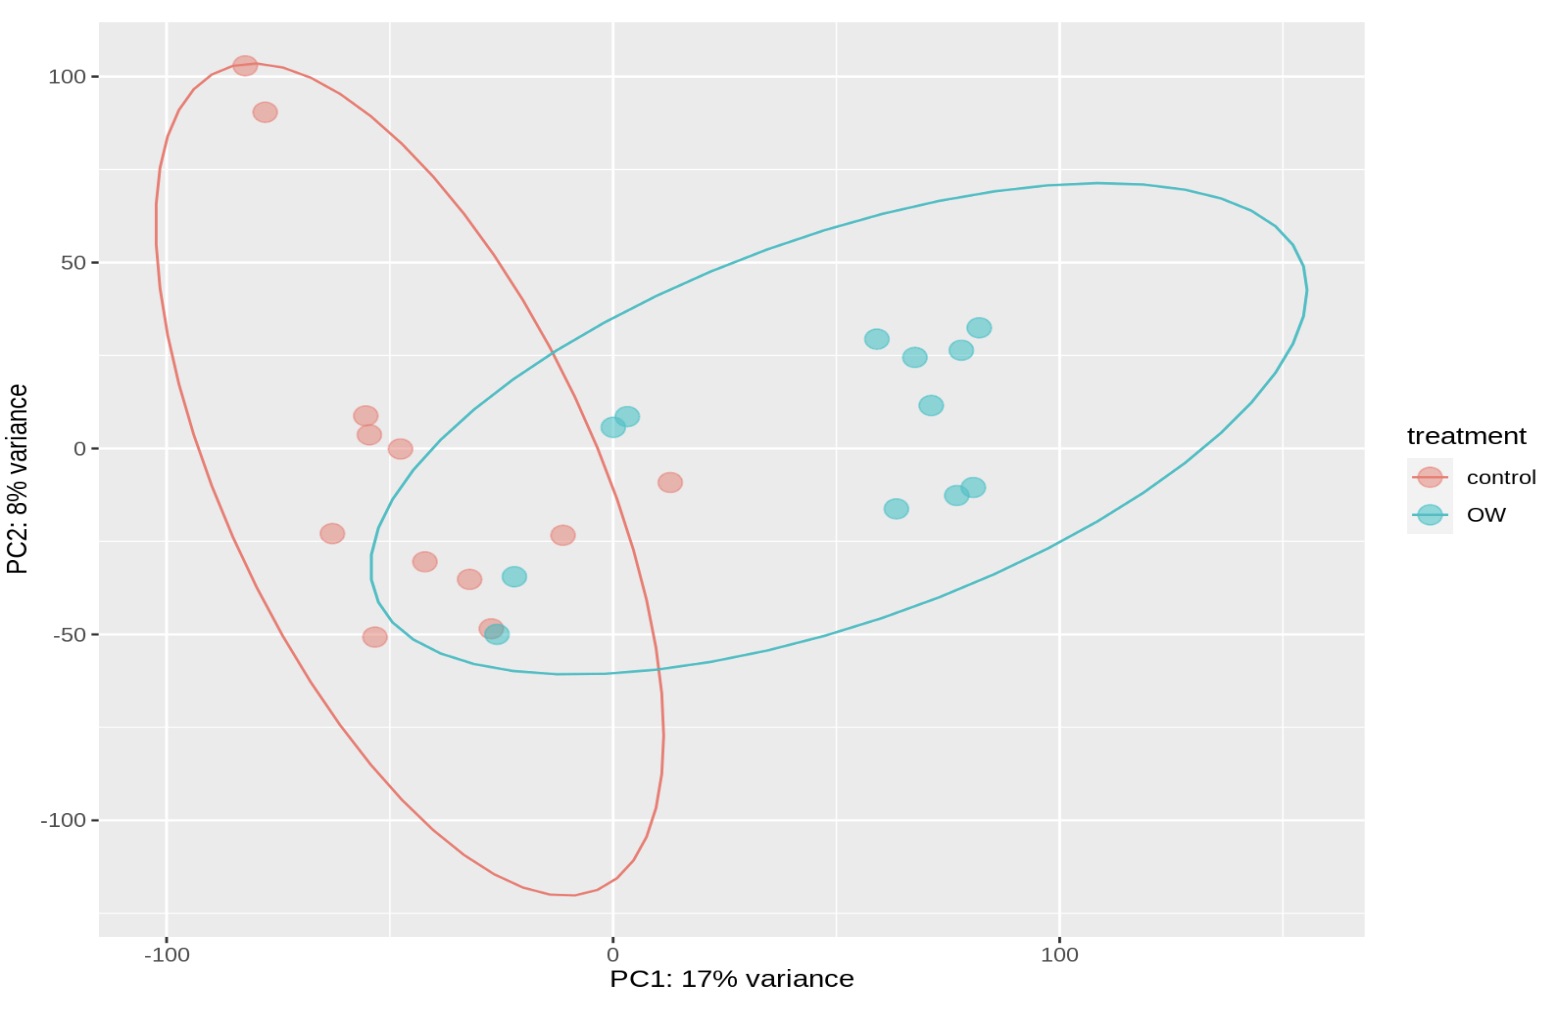
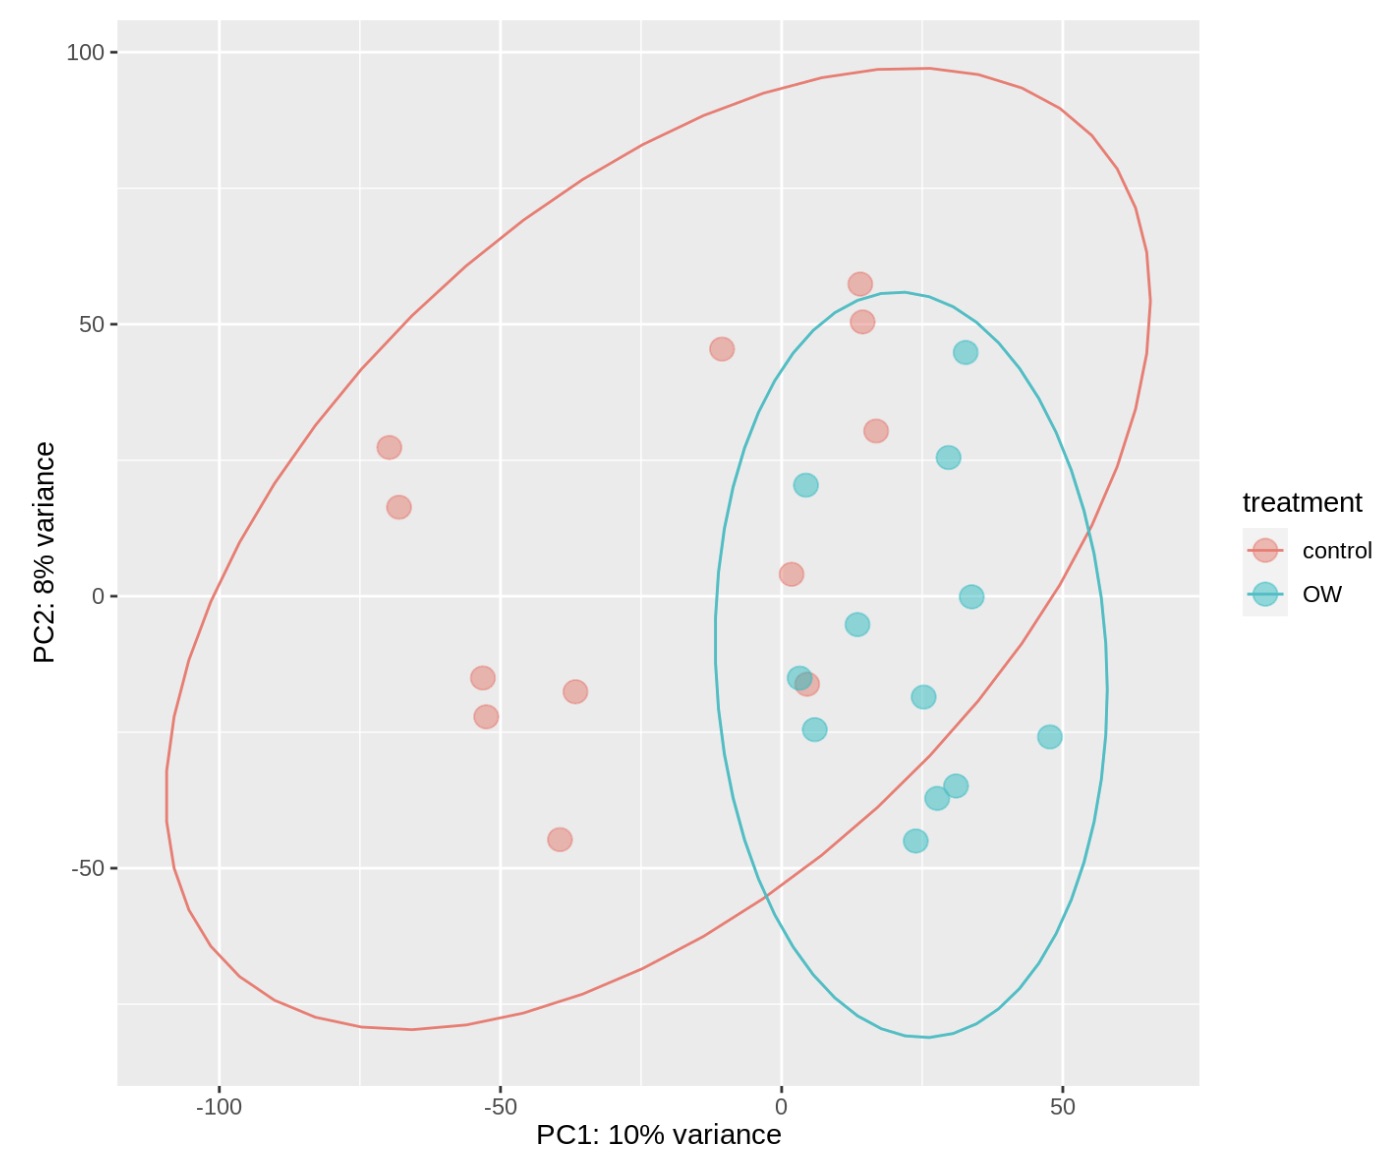
Ocean warming
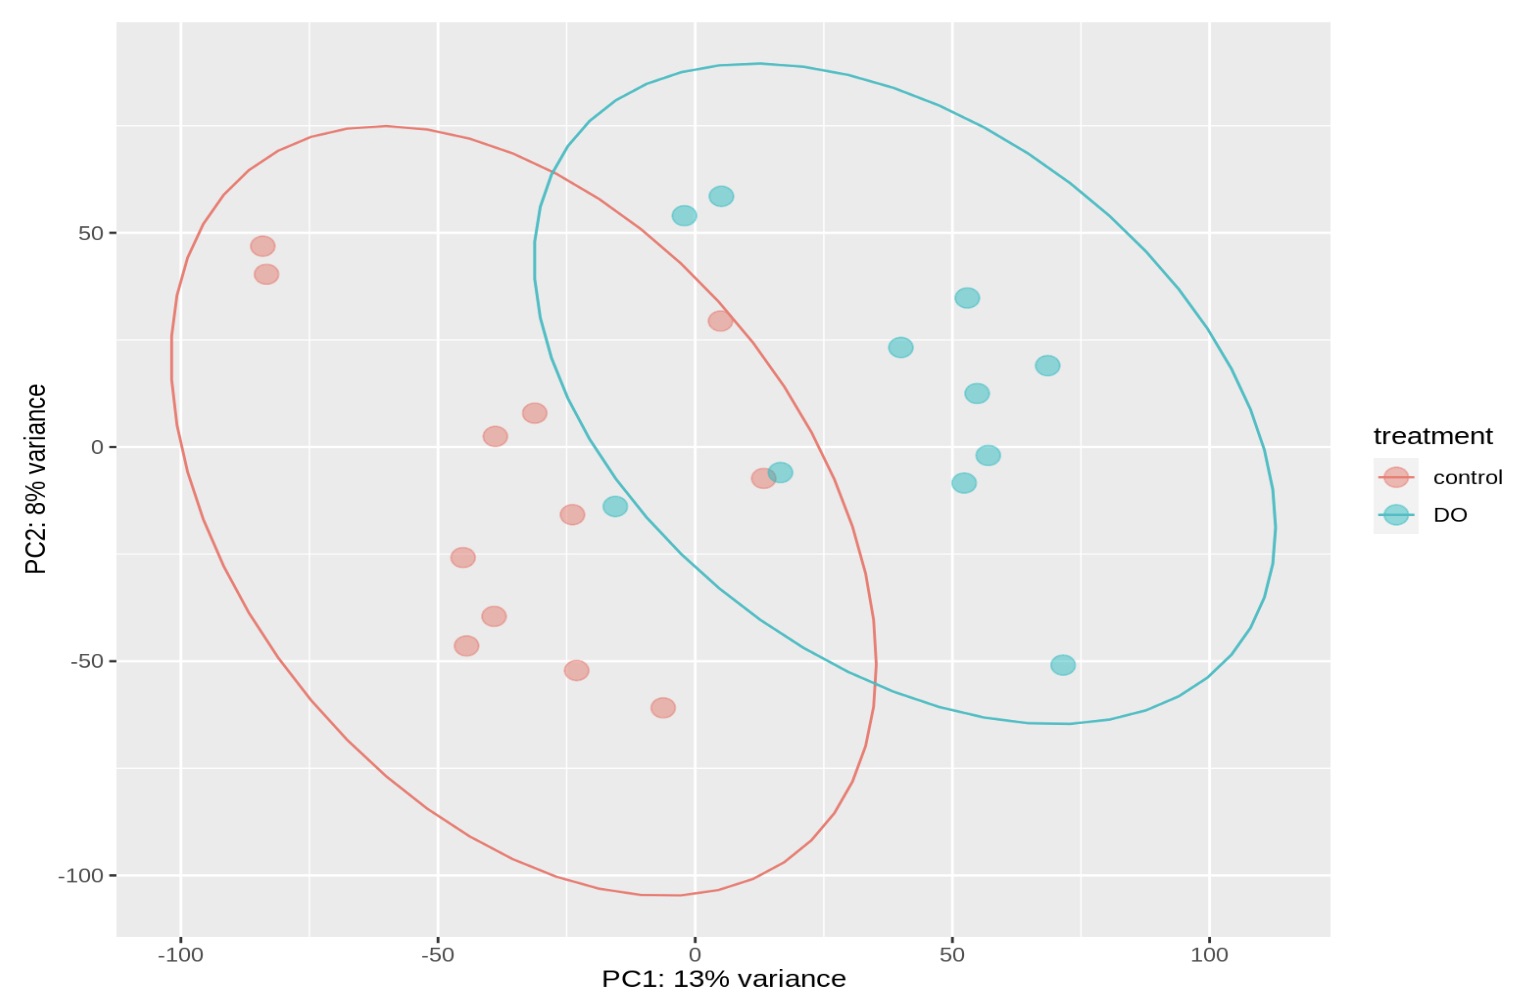
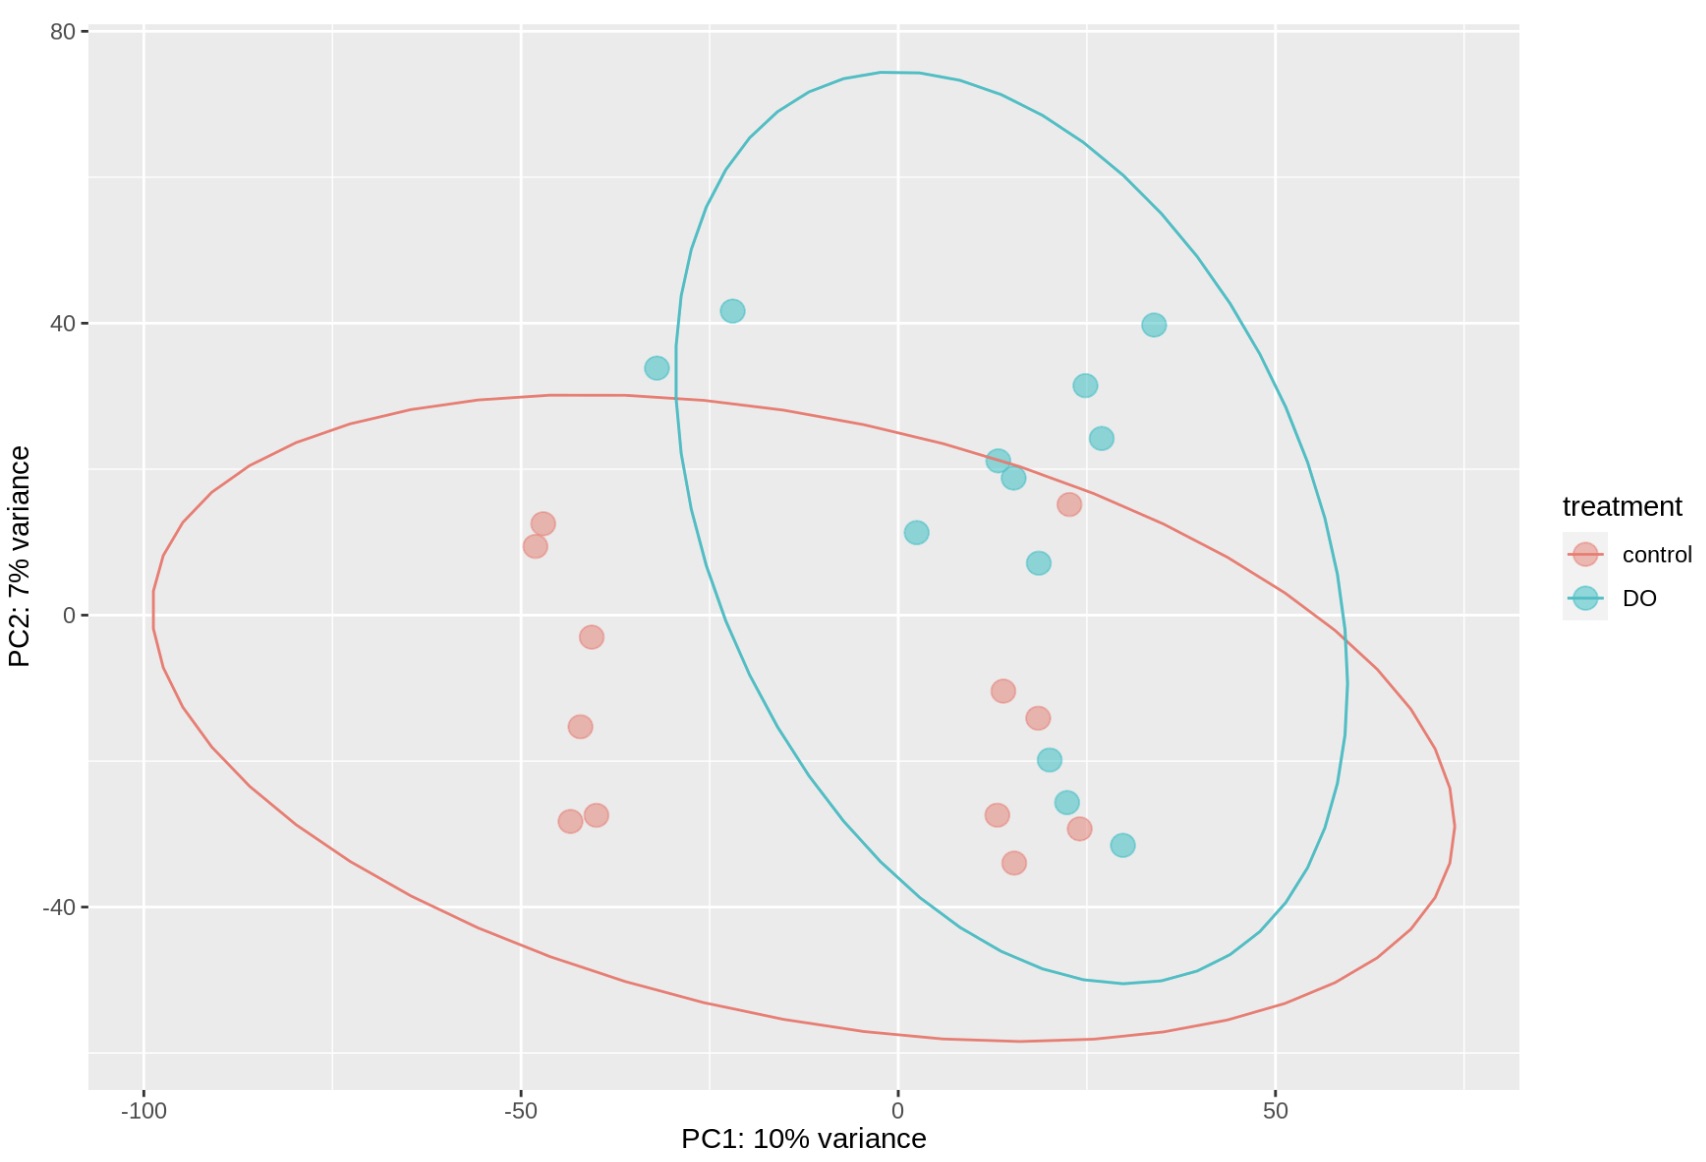
Hypoxia
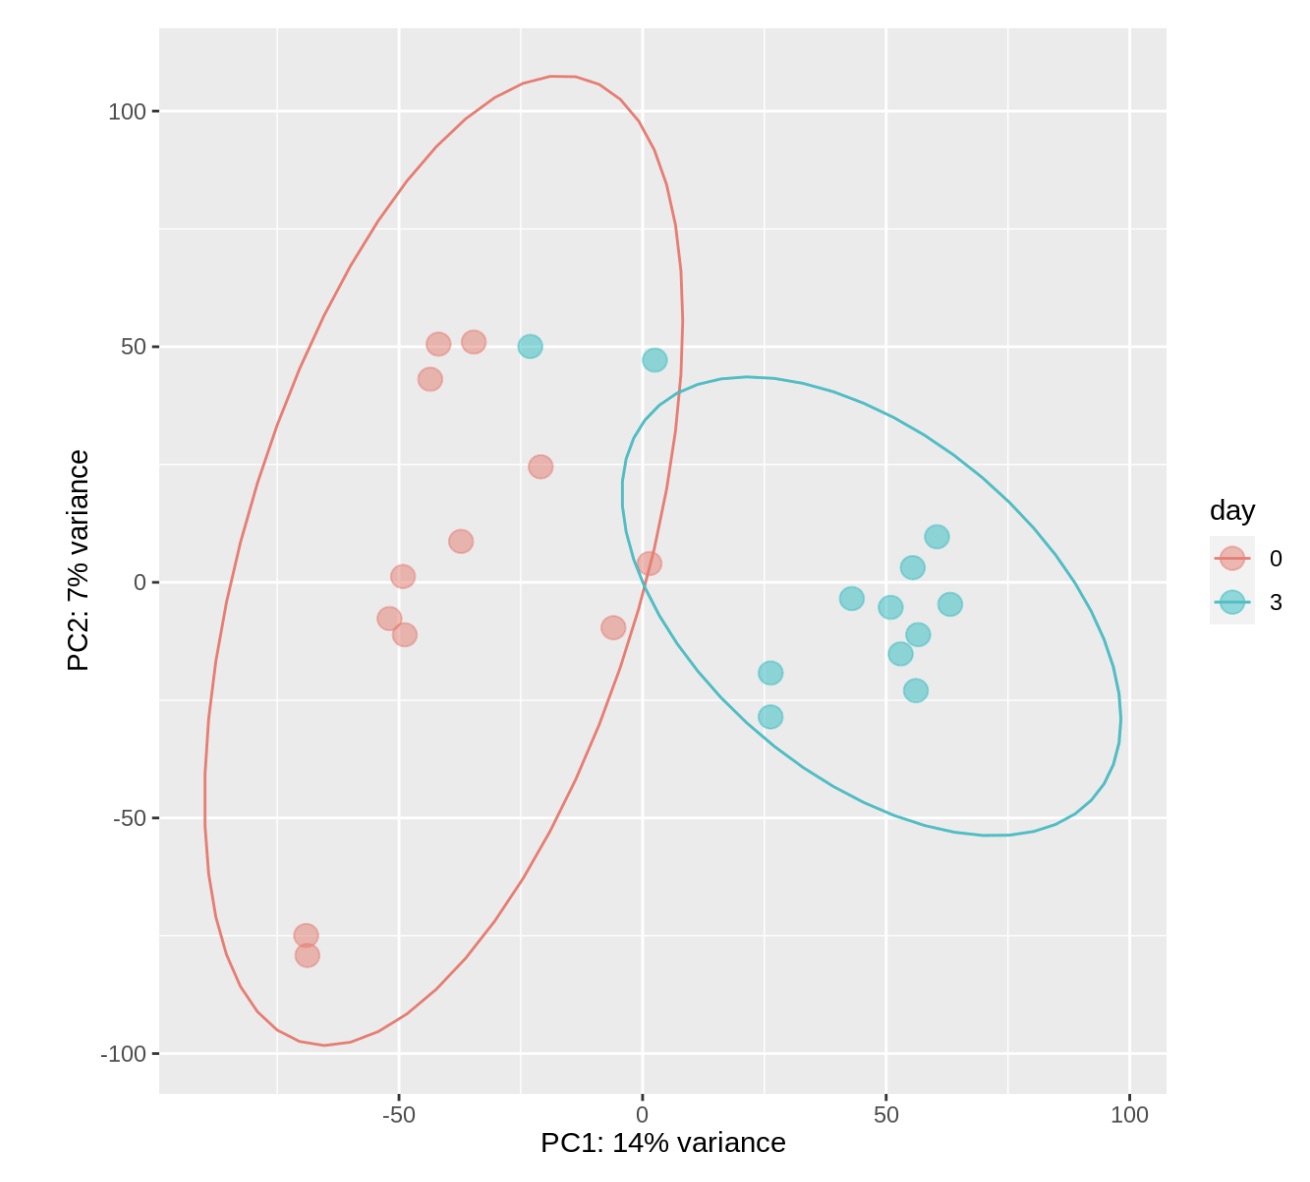
Control day 0 versus Control day 3
Gill PCA Plots
Overall
Ocean acidification
Ocean warming
Hypoxia
Control day 0 versus Control day 3